
Perth weekly market snapshot for the week ending 28 January 2024
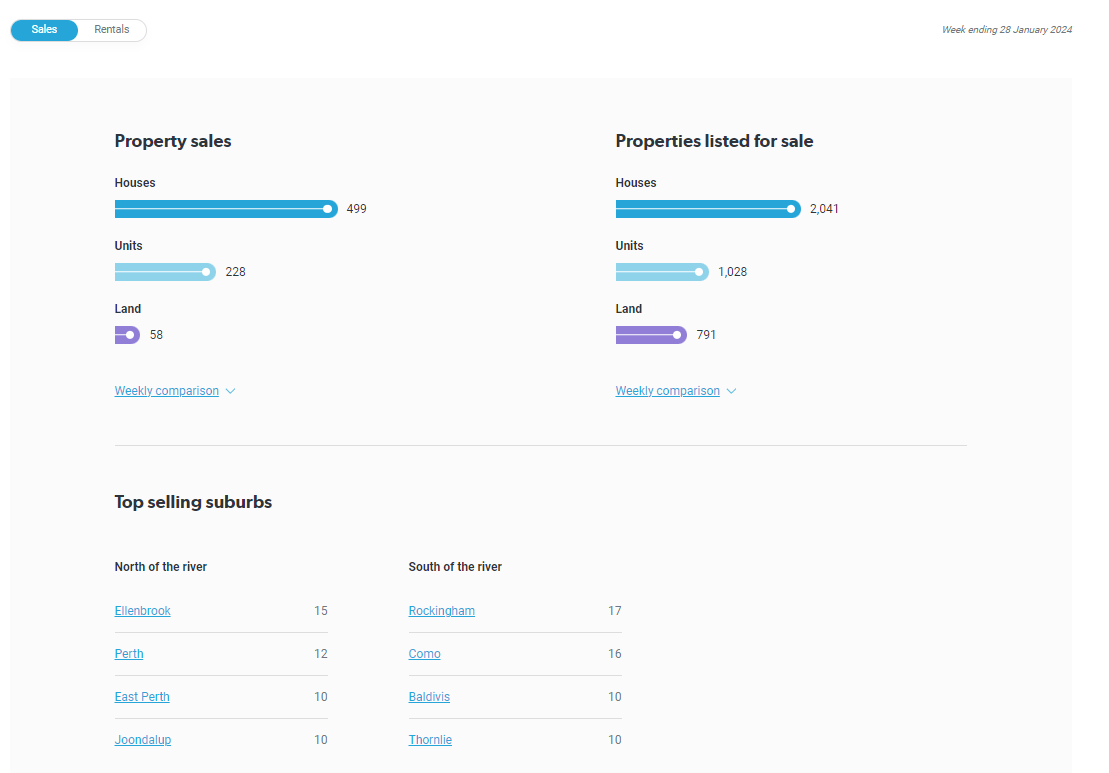
Sales transactions in Perth last week were 3.8 per cent lower than the previous week, with REIWA members reporting 792 transactions. A closer look shows house sales were 8.3 per cent lower than the week prior, unit sales were up 7.1 per cent and land sales were the same as the previous week.
Top performing suburbs – sales
- Rockingham – 17
- Como – 16
- Ellenbrook – 15
- Perth – 12
- East Perth – 11
Perth’s highest sale price: Wannanup – $1,900,000
Perth’s lowest sale price: Furnissdale – $179,000
There were 3,860 properties for sale in Perth at the end of last week, which is similar to the previous week. This can be attributed to house listings increasing 1.0 per cent compared to the week prior and vacant land listings increasing 2.5 per cent, while unit listings decreased 4.1 per cent.
Last week’s total figure of properties available for sale is 5.8 per cent higher than four weeks ago and 45.9 per cent lower than levels seen a year ago.
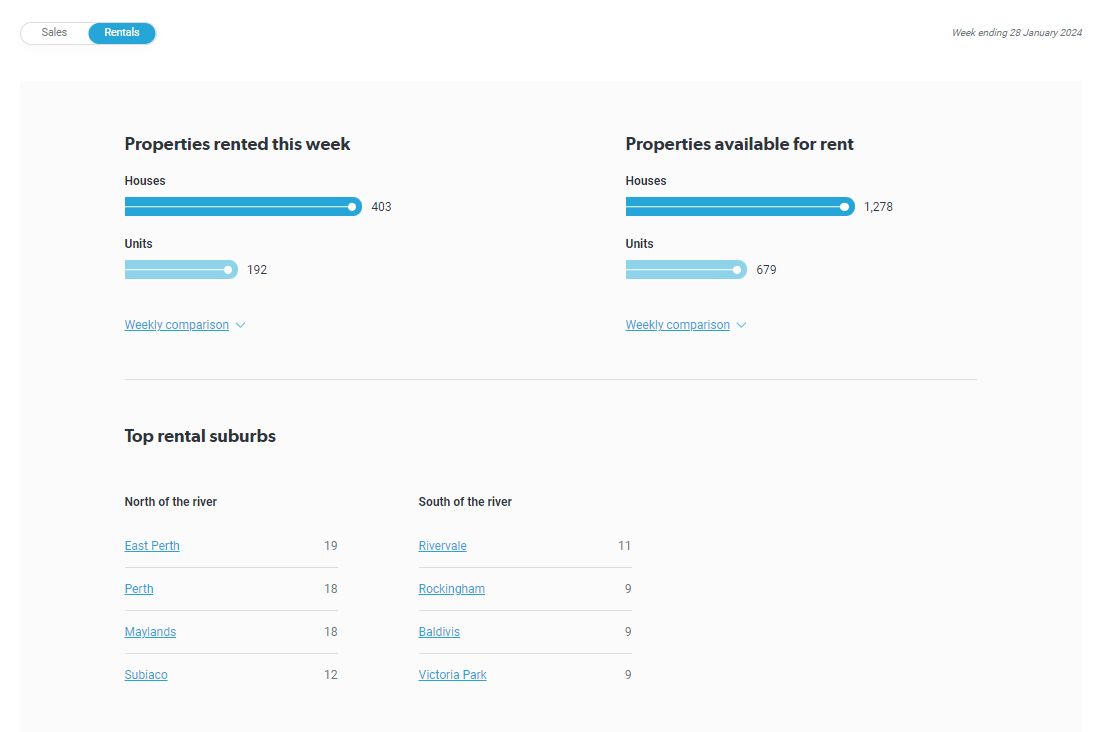
In Perth’s rental market, REIWA members reported there were 1,957 properties for rent in Perth at the end of last week, which is 2.0 per cent lower than the week prior. Last week’s rental listings figure is 28.9 per cent higher than four weeks ago and 2.7 per cent higher than a year ago.
Top performing suburbs – rentals
- East Perth – 19
- Maylands – 18
- Perth – 18
- Subiaco – 13
- Rivervale – 11
REIWA members reported 597 properties leased last week, which is 14.7 per cent lower than the previous week, 317.5 per cent higher than four weeks ago and 4.6 per cent higher than a year ago.
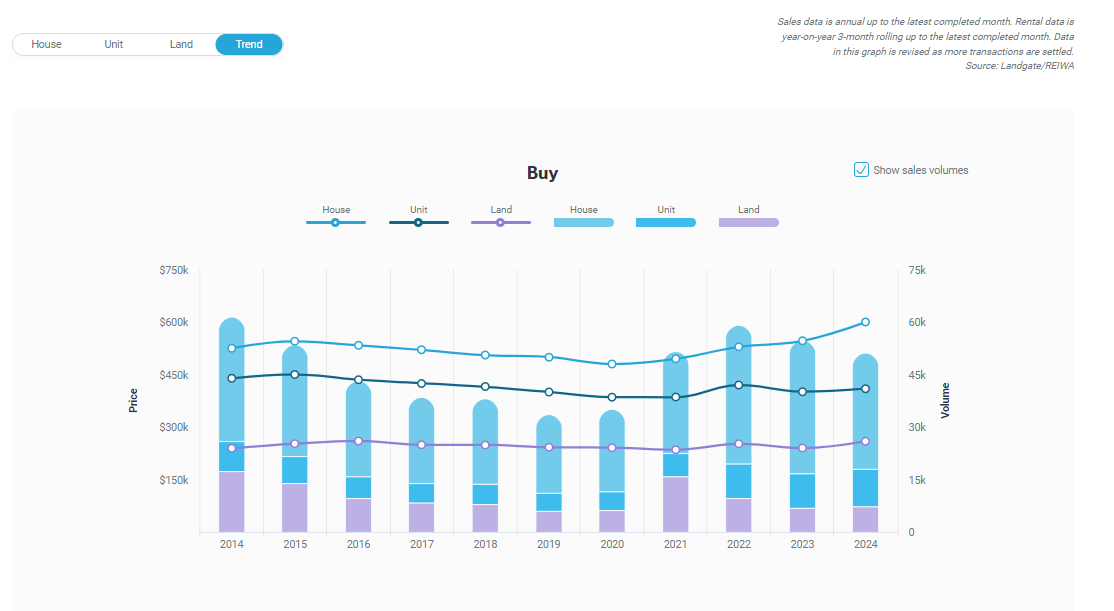
Median price data
Median price data last updated 2 February 2024 containing transactions for the 12 month period ending January 2024.
Sales data is annual up to the latest completed month. Rental data is year-on-year 3-month rolling up to the latest completed month. Data in this graph is revised as more transactions are settled.
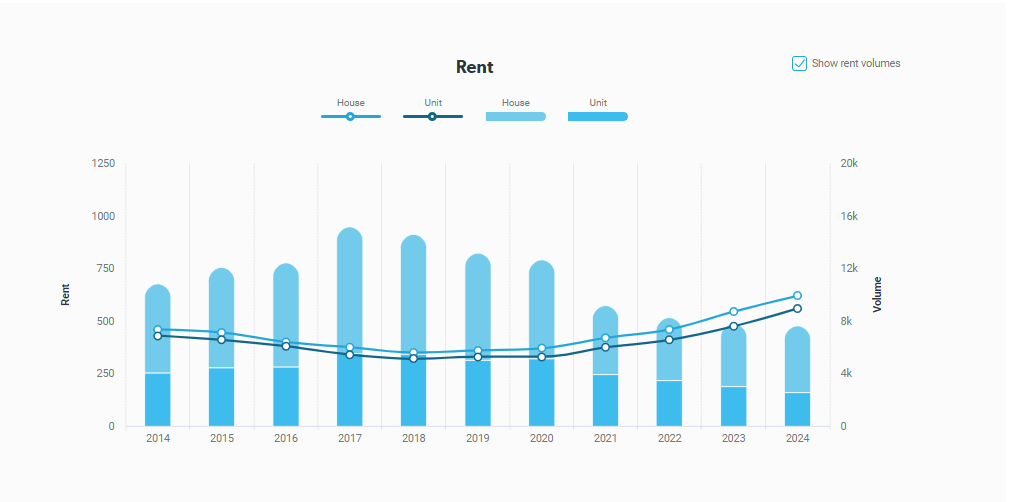
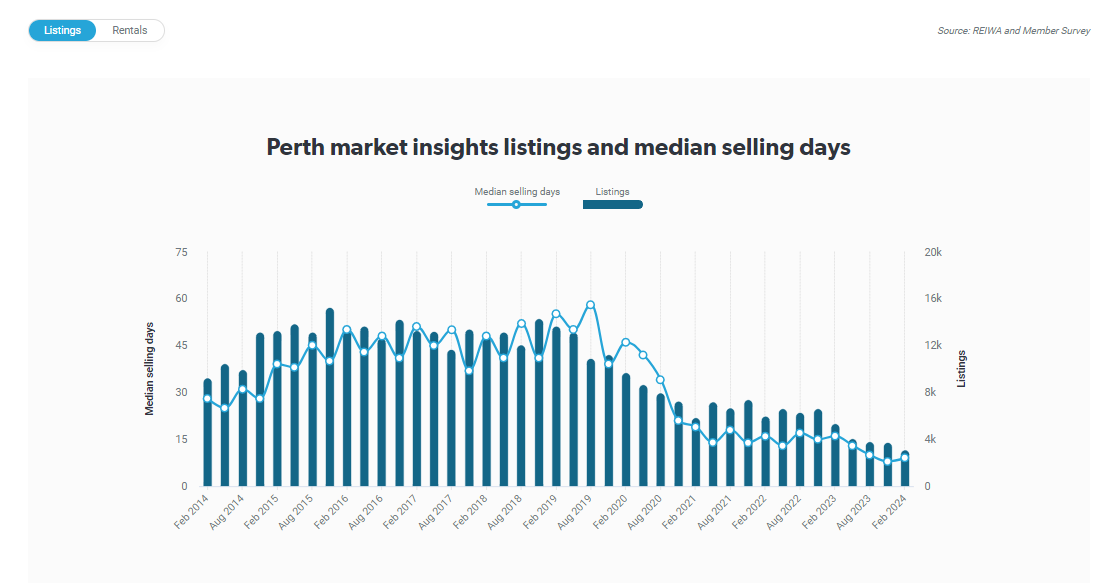
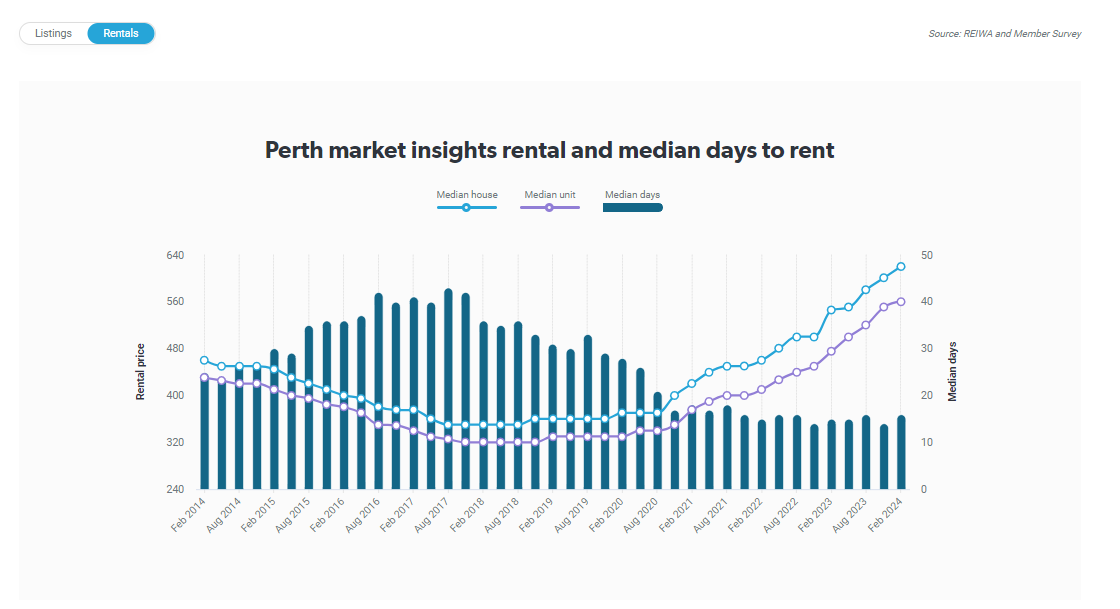
Listing and rental trends
Data in these graphs is for houses and units in the Perth Metro region. The Listing graph includes the latest sales listings with median days to sell. The Rental graph includes the median weekly rents and median days to rent.
SOURCE: www.reiwa.com.au