Perth Monthly Market Wrap
by Brett White
The property market is affected by factors such as current national or local economic conditions. Even weather and time of the year has an impact on the number of listings, average selling days, consumer sentiment and sales volumes. Taking this into account, it is quite hard to predict the future of the market and locate the exact reason for certain changes in the property market.
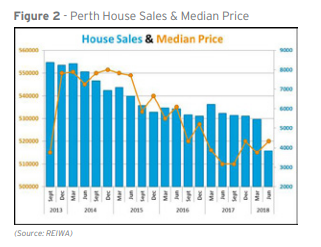
Looking at the data provided by Real Estate Industry of Western Australia (REIWA) below (see figure 1) we notice that there is a trend during the June quarter where the number of listings usually drop and will eventually start to increase around September with the exception of 2012 where the market performance reached its peak and 2017 where the market declined showing clear signs that there was a lack of consumer confidence all through out the year.

Sales volume peaked during 2013 caused by the rapid economic growth during the time. Perth experienced an increase in demand for all types of dwellings brought about the affluence of the time, propelled further by the interstate migrations. Stability of the market was maintained until the end of the mining construction phase where workers started to return to their respective homelands and some moving back to the east which had a major impact on the metropolitan area. See figure 2.
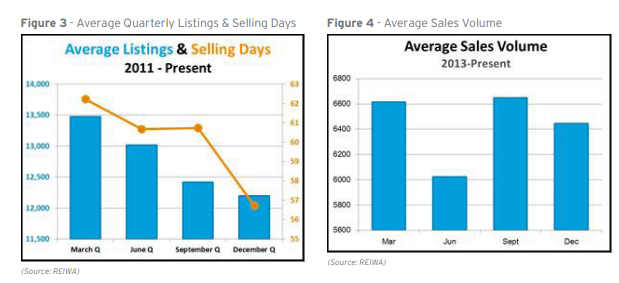
The Perth market has reached rock bottom levels of affordability in contrast to cities like Melbourne and Sydney. The data presented by the Housing Industry Association (HIA) showed that in the past 12 months, affordability in the area improved by 5.6%. We can attribute this to the falling median price of houses and the wage growth. This puts the median price in Perth to sit at around $520,000 for the June quarter. Another data presented by REIWA shows that for the past seven years, the March quarter presented the highest number of listings and gradually decreasing throughout the year and June having the lowest number in terms of sales volumes. Presented below is the average listing and selling days together with the average sales volume which shows us that for the past seven years, December has the least average selling days of 57.